Scan Smarter. Understand the Market.
Find Market Opportunities With Smarter Stock Scanning.
Screen technical conditions, track market activity and understand your scan results with AI-powered explanations.
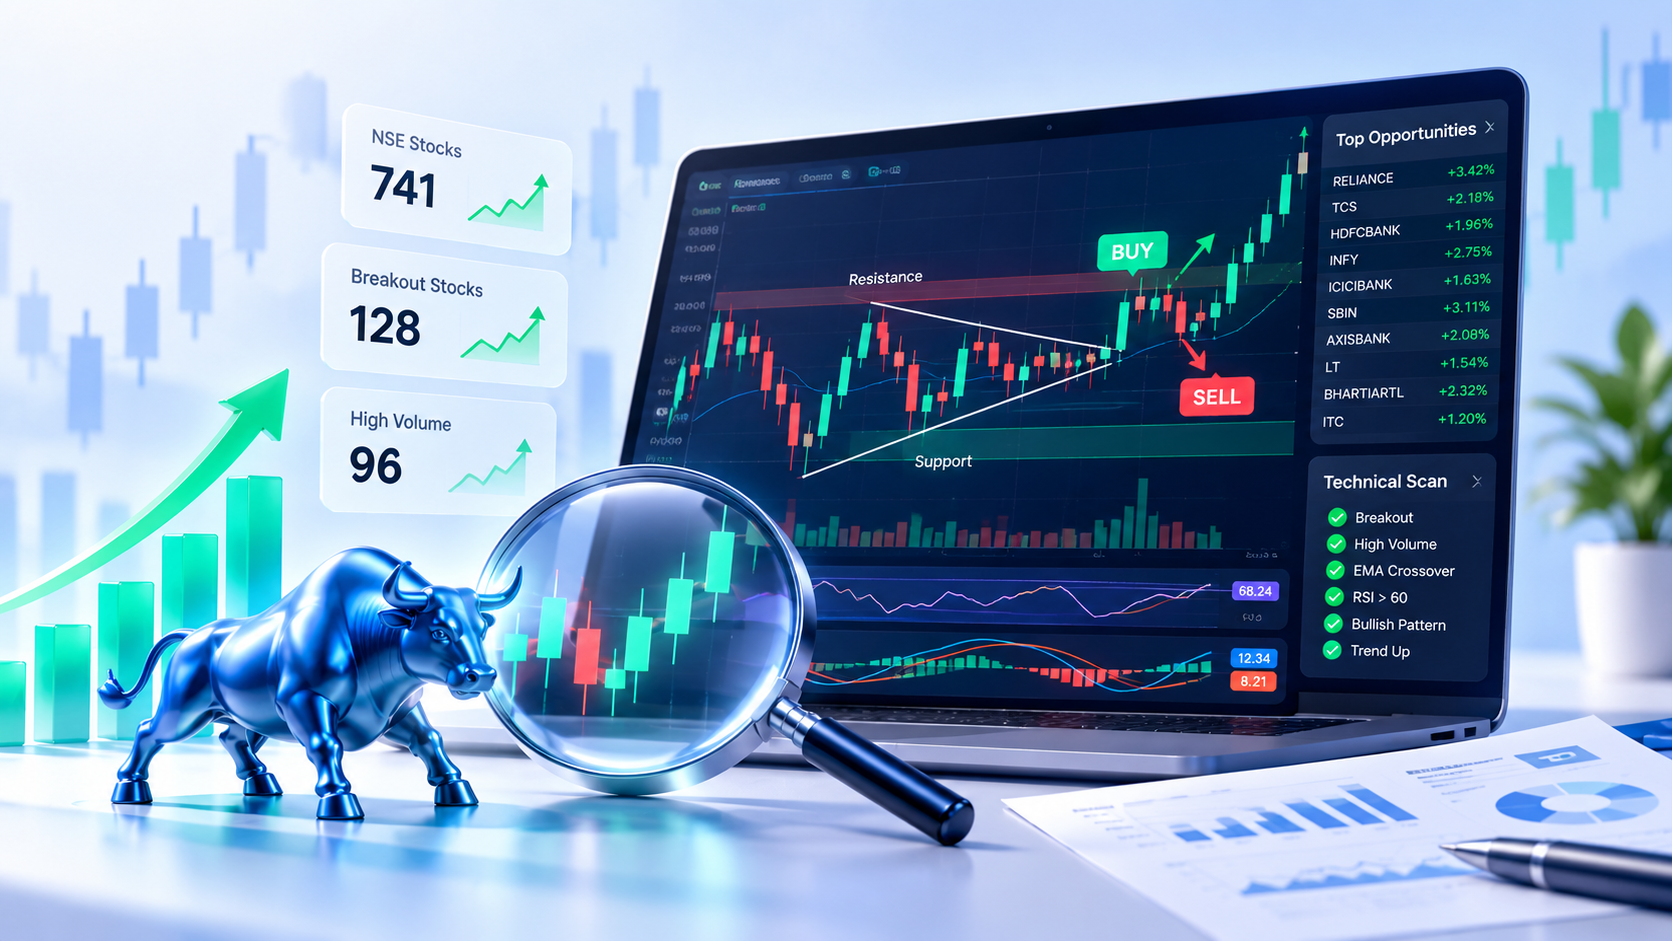
Illustration — not live prices
live feed market data
Live quotes, history, option chains
Official exchange reports
Delivery and participant OI
AI explanations
Explains data — never invents it
Everything a serious trader needs
Deterministic calculations first. AI explains — it never computes.
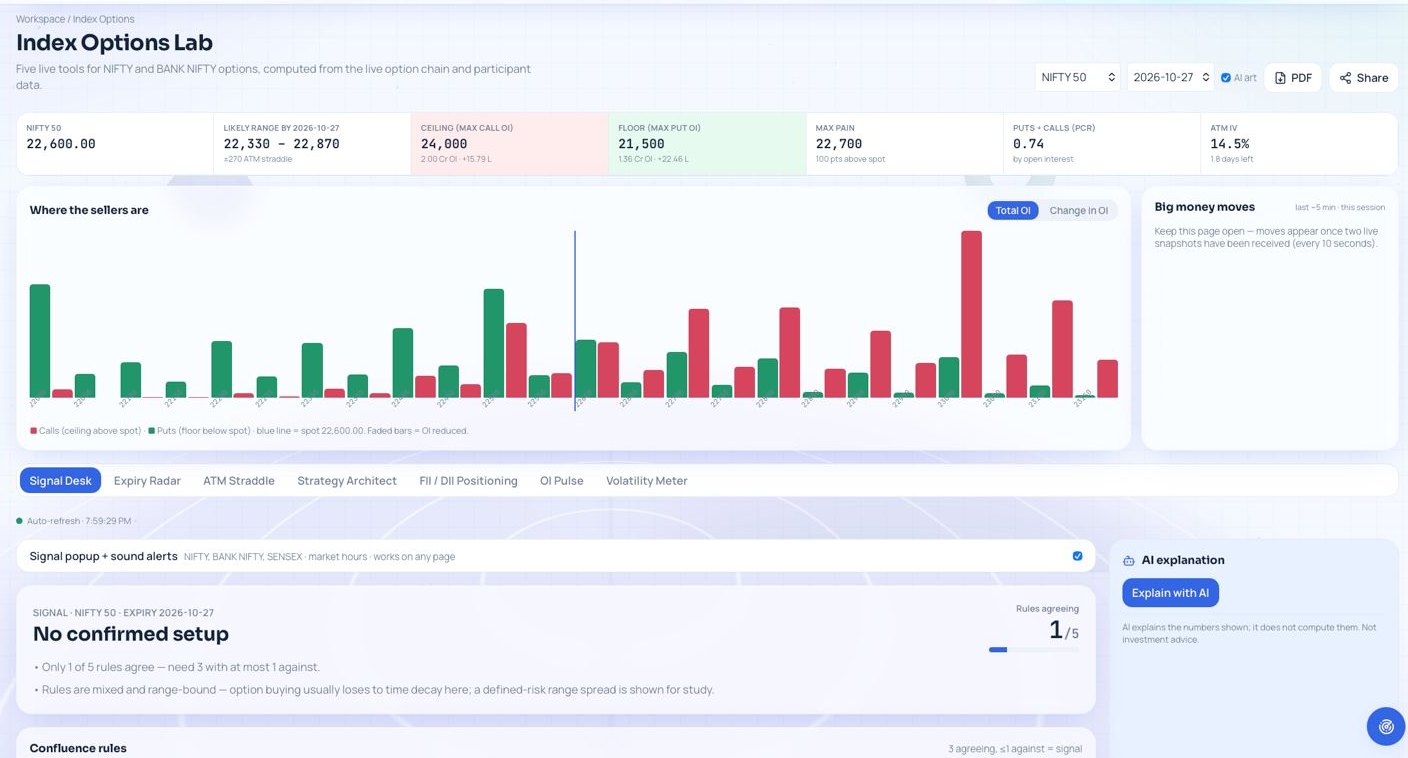
Screenshot from a past session — not live prices
Dashboard 01
Index Options Lab
Read NIFTY and BANK NIFTY like a pro: OI walls, max pain, PCR, signal desk, expiry radar and a defined-risk payoff builder.
- Live option chain
- Signal Desk with SL & targets
- FII/DII positioning
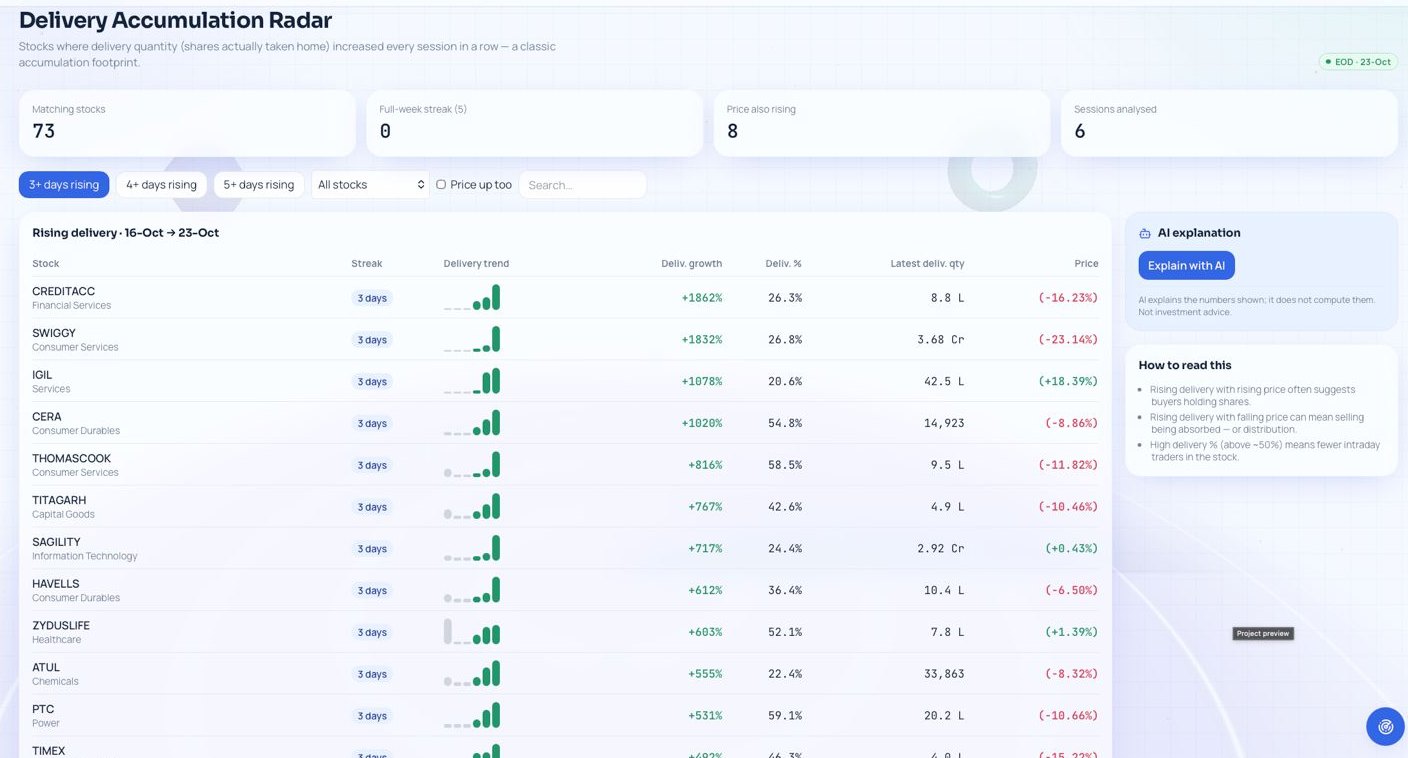
Screenshot from a past session — not live prices
Dashboard 02
Delivery Radar
Find stocks where delivery is climbing day after day, straight from official exchange delivery reports.
- Streak filters
- F&O and index filters
- Per-stock delivery trend
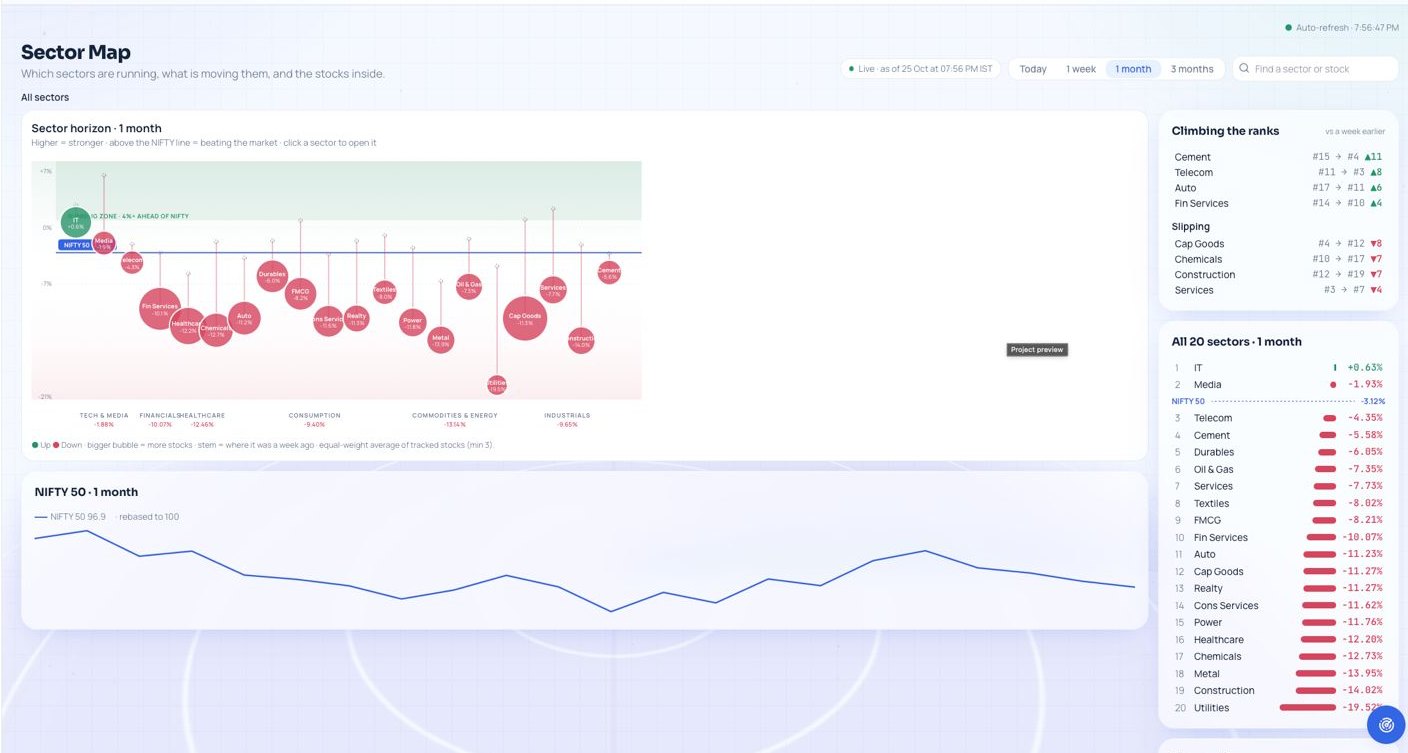
Screenshot from a past session — not live prices
Dashboard 03
Sector Map
See which sectors are beating NIFTY at a glance, then open any sector to see its leaders and laggards.
- Today / 1W / 1M / 3M
- Rank history
- Stock bubbles per sector
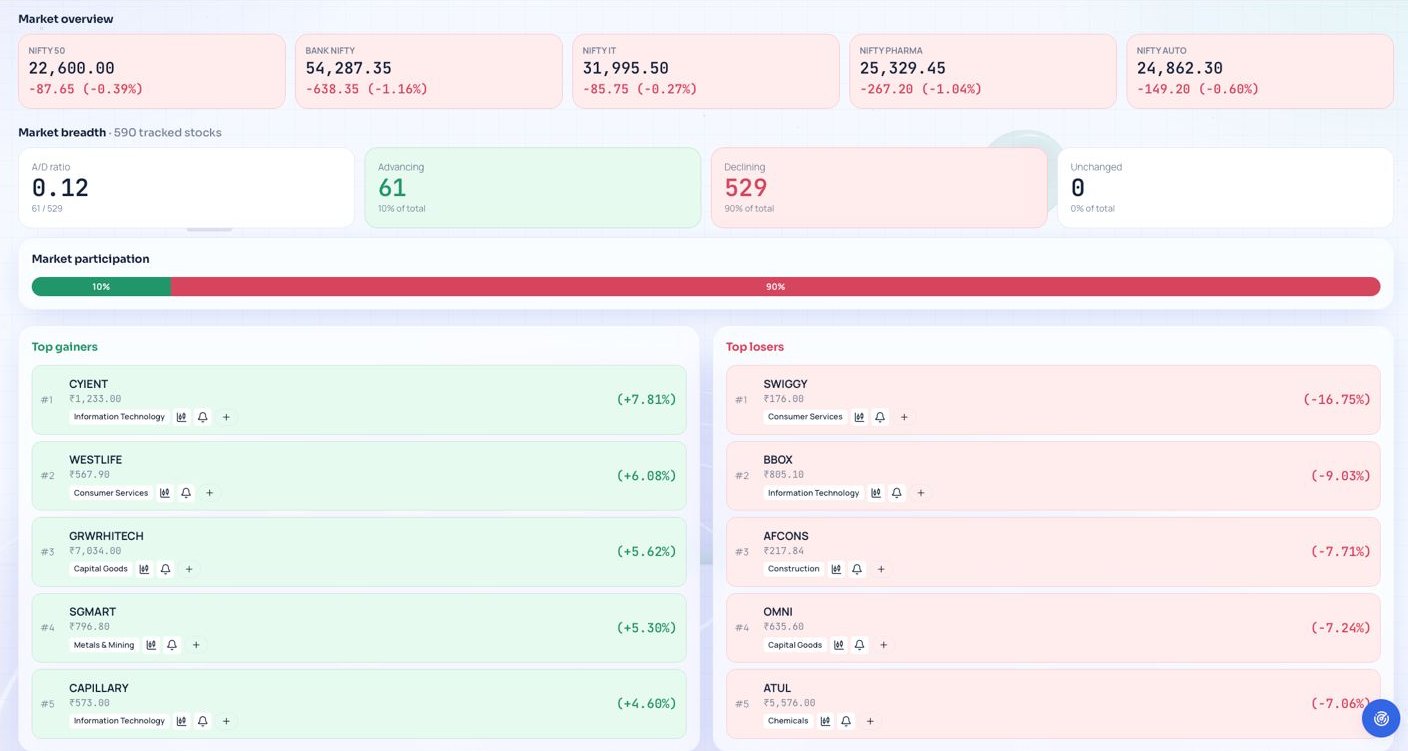
Screenshot from a past session — not live prices
Dashboard 04
Market Pulse
Index overview, advance/decline breadth and the day's top gainers and losers in one clean board.
- Live breadth
- Top gainers & losers
- One-click alerts
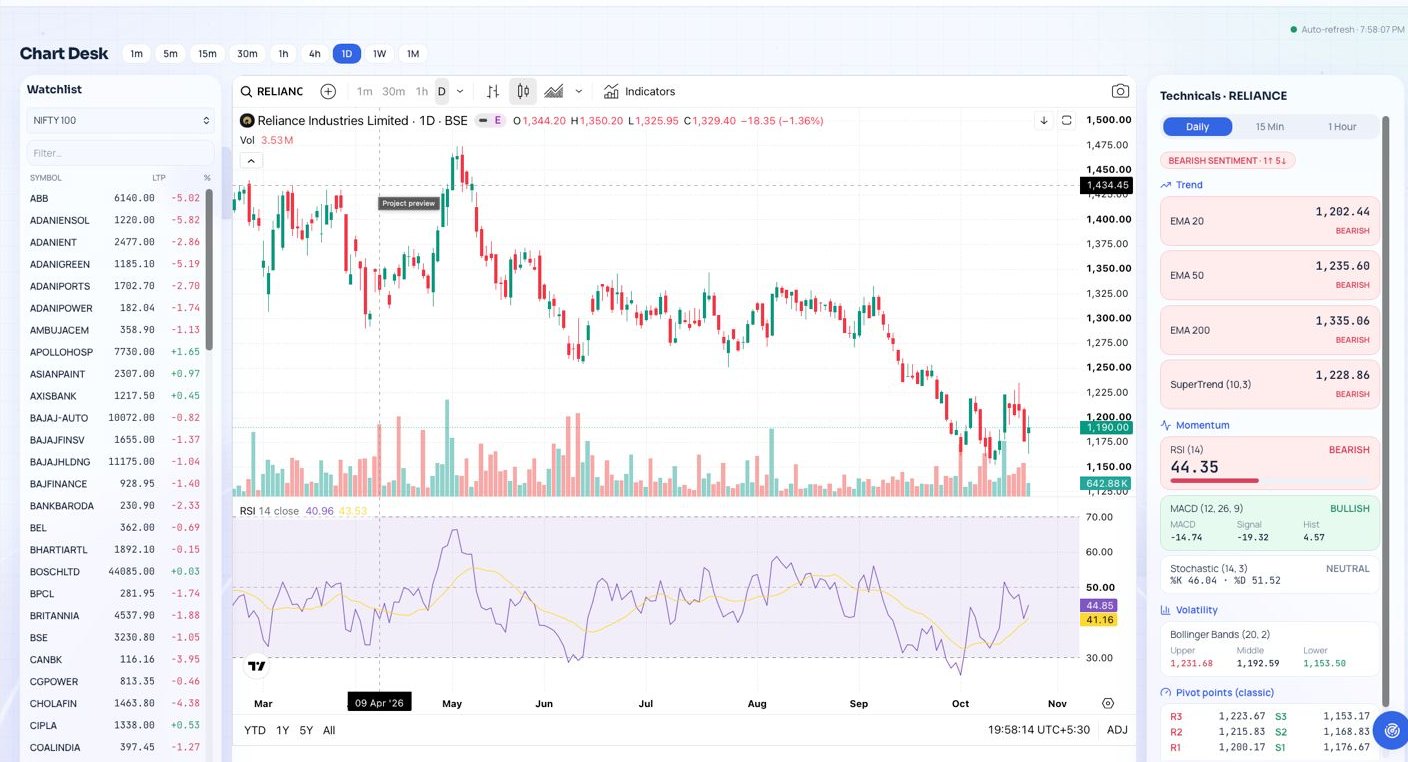
Screenshot from a past session — not live prices
Dashboard 05
Chart Desk
Pro charts on every timeframe with a watchlist and a full technicals panel beside it.
- 1m to 1M timeframes
- EMA, SuperTrend, RSI, MACD
- Pivot points
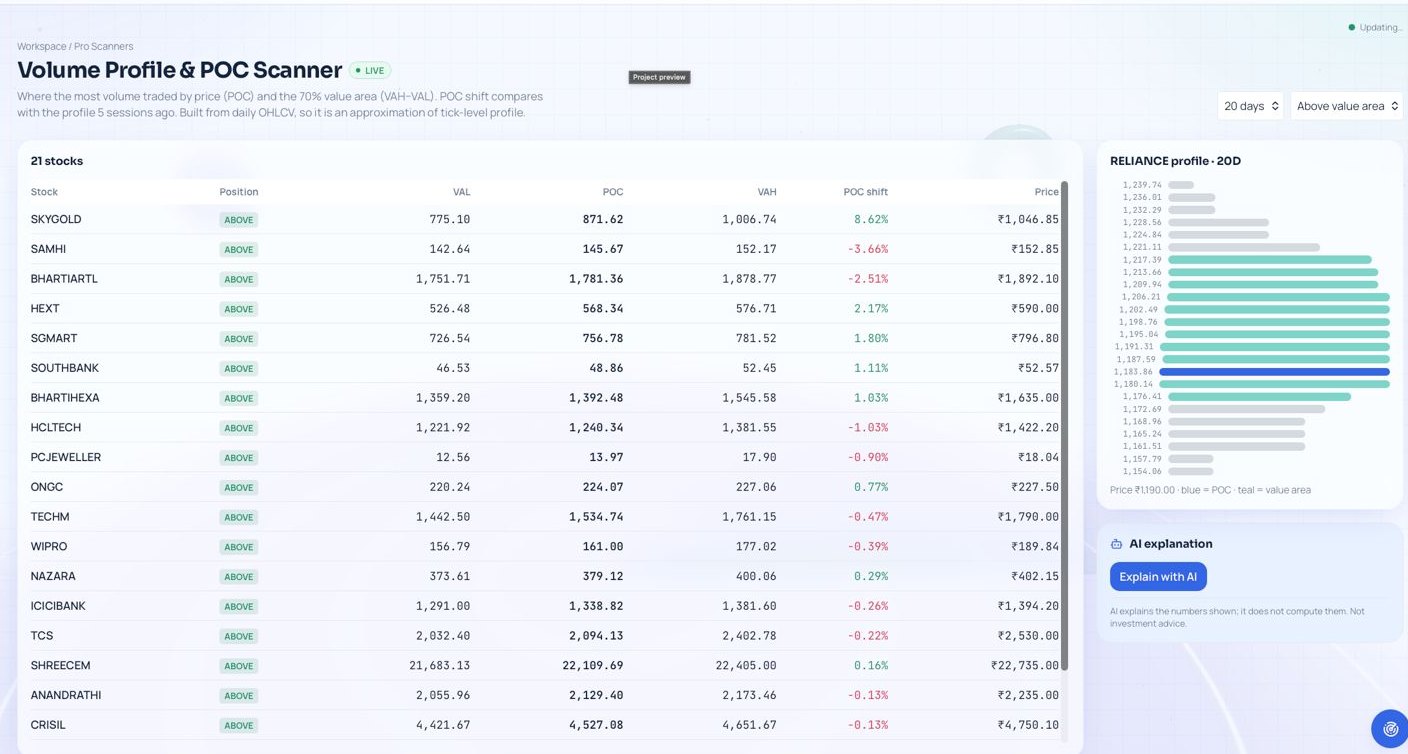
Screenshot from a past session — not live prices
Dashboard 06
Volume Profile & POC
See where the most volume traded — POC and value area — for every stock, and how price sits against it.
- VAL / POC / VAH
- POC shift
- Profile chart
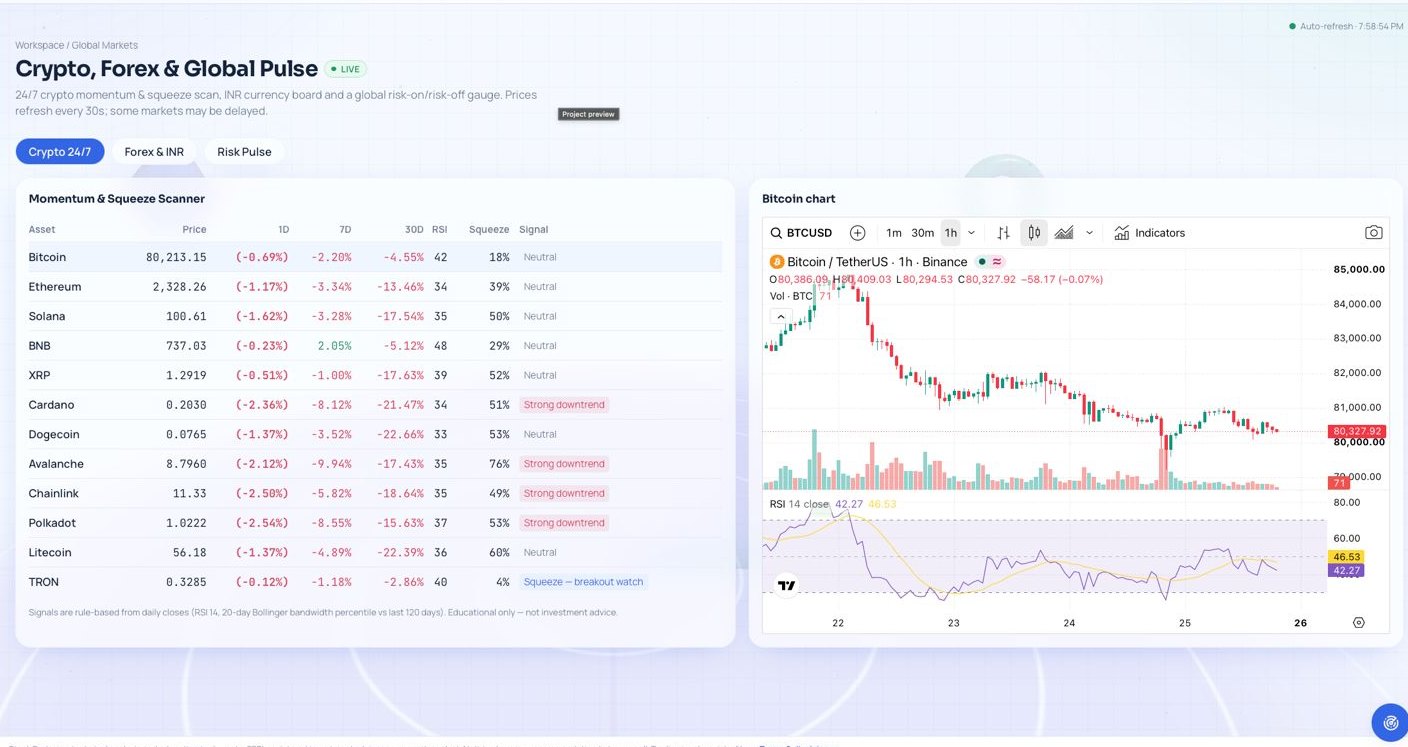
Screenshot from a past session — not live prices
Dashboard 07
Crypto, Forex & Global Pulse
24/7 crypto momentum and squeeze scan, INR currency board and a global risk-on / risk-off gauge.
- Crypto squeeze scanner
- Forex & INR
- Risk Pulse
How it works
- 01
Pick or build a scan
Start from a preset or compose your own conditions.
- 02
Review matched evidence
Every result shows which conditions passed and when.
- 03
Understand with AI
Get a structured explanation of support, conflicts and risks.
Simple pricing
PROPOSED PRICESFAQ
Support: WhatsApp +91 96629 29451
Risk disclosure: Trading in securities and derivatives involves risk. Stock Radar is not a SEBI-registered advisor and does not provide investment advice.